
Q4 & December 2025 Update & Fund Commentaries
Hi all,
I trust everyone has had a cracking start to the new year! I had a lovely trip to the UK with my family and am back in the saddle and very excited for the year ahead! Here with some thoughts for you if you fancy.
The end of 2025 and the start of 2026 have been remarkably positive for investors. It's been one of those periods where the markets have really rewarded patience and discipline!
The South African Rand has staged an impressive comeback, strengthening significantly against the US dollar, from around R16.57 at the end of last year to the mid-to-low 15s recently (hovering around 15.70–15.80 and dipping even lower in some sessions). This is one of its strongest runs in years, supported by better domestic fundamentals, solid commodity prices, and positive global flows coming our way.
The JSE All Share Index closed 2025 on a high note, up around 38.5% for the year, finishing just shy of 116,000, and the momentum has carried straight into 2026. Resources like gold and platinum miners led the charge, alongside strong contributions from financials and broader participation. The index has now pushed past 125,000, recently trading in the 125,000–126,900+ range, which really reflects growing investor confidence.
Globally, equity markets were robust in 2025 too, with international and emerging markets often stealing the show (think MSCI Emerging Markets up around 33–34%, MSCI World in the 21–22% zone), building on the positive years in 2023 and 2024. It's a clear reminder of why diversified exposure across regions makes such a difference.
Looking ahead to the rest of 2026, there are a few key risks worth keeping an eye on. Globally, we're seeing elevated valuations, the potential for bubbles (especially in tech and AI-driven areas), geopolitical tensions (trade tariffs, multipolar world shifts), policy uncertainties around interest rates and fiscal paths, and the ever-present chance of slowdowns or stubborn inflation. Closer to home in South Africa, structural challenges like infrastructure constraints, high public debt pressures, political and coalition dynamics, currency swings, and external shocks from global trade changes are still part of the landscape.
That said, our portfolios have held up beautifully through recent periods, delivering strong and resilient results thanks to the thoughtful diversification and disciplined allocation we've always prioritised. Our custom-built, multi-asset approach, strengthened by our long-standing partnership with PortfolioMetrix, helps us navigate these uncertainties with balanced local-global exposure, active risk management, a real focus on capital preservation, and by steering clear of over-concentration in any one theme or region. It positions things for resilient, long-term outcomes, even when the environment gets choppy.
This track record and our prudent strategy continue to underline the real value of staying diversified and disciplined over time. Here's to a strong and steady continuation through 2026!
Sending love,
Richard & the F&A team
INTRODUCING PMX’S NEW AVATARS
We wanted to let you know about a small but important change to how we present some of our video communications. Up to now, some of our videos have featured AI-generated avatars modelled on members of our PMX leadership team. Going forward, we will be using two new avatars, named Portia and Felix. We are making this change for two key reasons:
CLARITY & TRANSPARENCY
We want it to be immediately obvious when a video is AI-generated versus when you are seeing or hearing directly from a member of our leadership team. Using clearly defined avatars removes any ambiguity.MORE REAL-WORLD ENGAGEMENT FROM OUR LEADERSHIP TEAM
As our leadership team becomes more involved in live interviews, events, and in-person engagements, this distinction will help ennsure it’s always clear when communication is happening in real life versus via an AI-assisten format.
Portia and Felix will be used primarily to summarise and explain our investment commentaries and other informational updates. These videos are designed to make complex information easier to digest and absorb.


This piece is compiled by Philip Bradford, Head of Global Investment Strategy - PortfolioMetrix
This message includes the Quarterly Investment Update for Q4 2025, the December 2025 Monthly Update, and also a short write up on some upcoming portfolio changes. If you would like to jump ahead to each of these, please click the links below:


When concentration isn’t the enemy
KEY TAKEAWAYS:
Market concentration is a recurring and natural feature of equity markets, reflecting how capital flows toward companies with stronger fundamentals, earnings growth, and competitive advantages.
High concentration has historically said little about future market returns or risk, with periods of strong leadership followed by a wide range of outcomes driven more by fundamentals than index structure.
Reacting mechanically to concentration can be counterproductive, potentially reducing exposure to the most profitable businesses without meaningfully improving diversification or risk outcomes. .
WHY MARKET LEADERSHIP IS OFTEN A FEATURE, NOT A FLAW
Market concentration is often viewed as a warning sign, particularly from a portfolio risk perspective. Periods where a small number of companies dominate index weights, drive market returns, and attract the bulk of investor attention are typically interpreted as a signal that risk is rising, prompting some investors to reduce exposure.
While this concern is understandable, it is also incomplete. A growing body of evidence suggests that market concentration is not inherently a risk in and of itself. In many cases, it reflects the way markets allocate capital over time, rewarding strong fundamentals, reinforcing successful business models, and allowing leading companies to grow. The more important question for investors is not whether markets are concentrated, but what is the nature of that concentration and how is it managed within a well-constructed portfolio.
CONCENTRATION IS NOT NEW AND NOT UNUSUAL
While today’s market leadership may feel unprecedented, history suggests otherwise. Periods of elevated concentration have occurred many times before, often during phases of technological change, productivity growth, or major economic transitions.
CHART 1: Shifts in industry and stock concentration in the S&P500
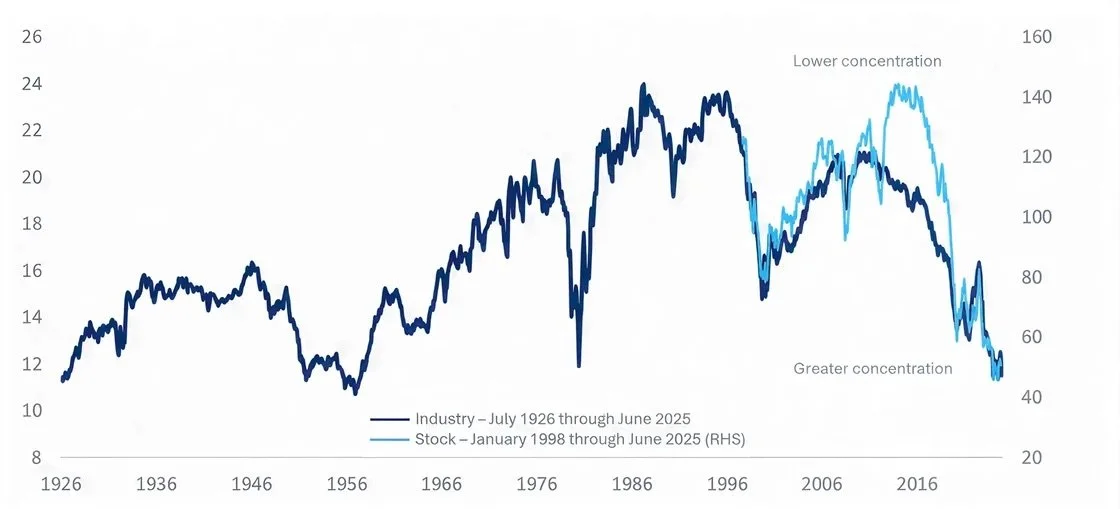
Source: StateStreet: “The Fallacy of Concentration”. Lower values imply greater concentration
The chart above shows that the US equity market has indeed become more concentrated in recent years, driven both by industry effects (notably technology) and by individual stock effects. However, measured over long history, today’s concentration is not unprecedented and sits well within historical experience.
THE US MARKET IS NOT AN OUTLIER GLOBALLY
Another common misconception is that concentration is a uniquely US phenomenon.
CHART 2: Stock market concentration in the largest global equity markets
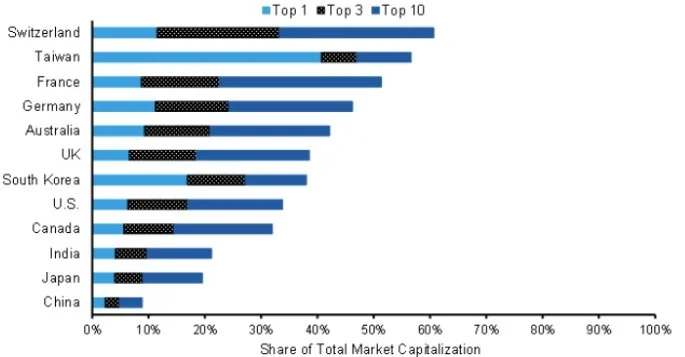
Source: Counterpoint Global, FactSet. As at 30/09/2025
When compared internationally, the US equity market sits around the middle of the pack, with several developed markets exhibiting higher levels of concentration.
Seen in a global context, concentration is a normal feature of equity markets rather than a sign of excess. Many highly concentrated markets continue to function efficiently, providing diversification and long-term growth opportunities.
WHY CONCENTRATION EMERGES IN THE FIRST PLACE
Markets are not designed to distribute capital evenly. They are designed to allocate capital towards the most successful businesses. As companies grow, they attract capital, talent, and customers. Success reinforces success. Over time, this leads to a skewed distribution of market capitalisation, where a small number of companies represent a large share of the index.
For example, the Magnificent 7's EPS growth (12 months trailing) has more than tripled in the last five years, leaving the EPS growth for the other S&P 500 companies in the shade.
CHART 3: EPS growth: magnificent 7 vs the rest of the S&P500 constituents
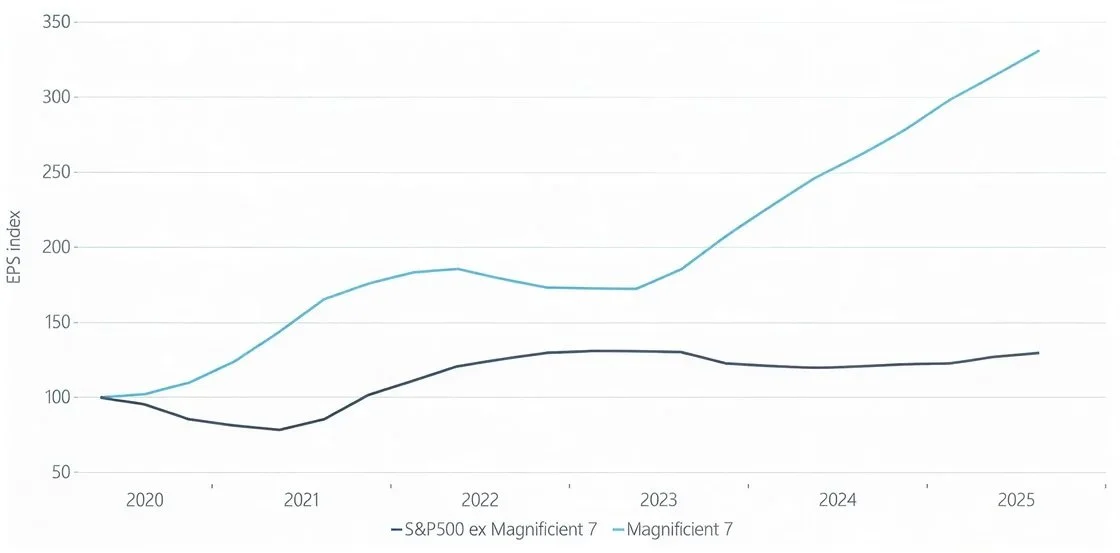
Source: Bloomberg, Barclays Private Bank. September 2025
A small number of companies naturally account for a large share of total market value, a pattern seen across industries, economies, and time. This dynamic is not an aberration. It reflects the same forces that drive concentration in wealth, income, and innovation more broadly. Concentration, in this sense, is a consequence of growth, not a warning sign.
DOES CONCENTRATION ACTUALLY INCREASE RISK?
This is the most important question and where intuition often diverges from evidence.
In State Street’s study, “The Fallacy of Concentration”, they tested a simple but powerful idea: if concentration truly increases risk, then reducing equity exposure when markets become more concentrated should improve outcomes.
It did not.
Table 1 and Chart 4 below, show the results of a dynamic trading rule compared to a buy-and-hold strategy.
TABLE 1: Return and risk of constant and dynamic strategies
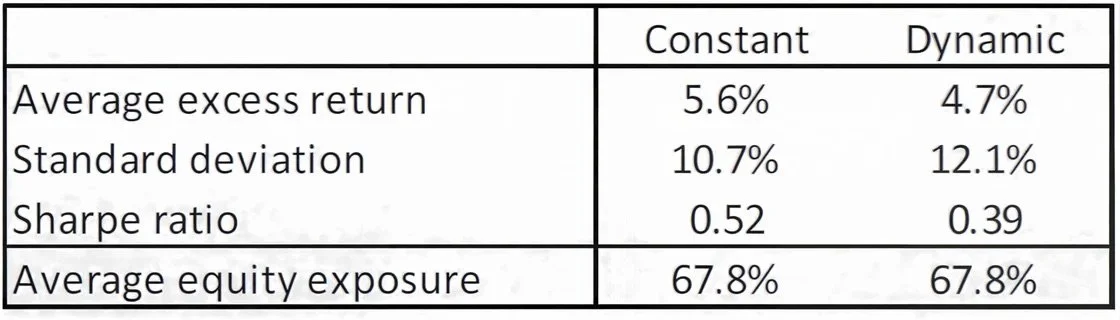
CHART 4: Cumulative returns of constant and dynamic strategies (log scale)
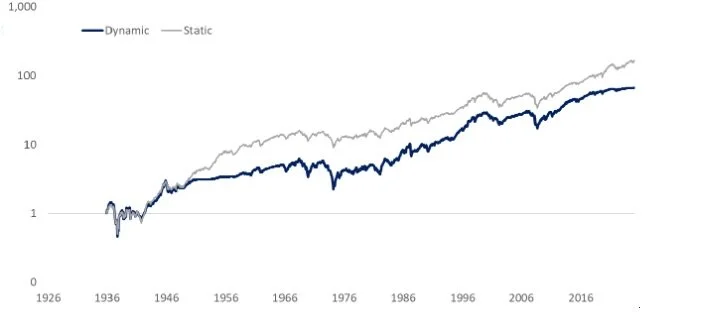
Source: StateStreet: “The Fallacy of Concentration”.
The strategy that cut equity exposure when markets become more concentrated historically delivered lower returns and higher volatility than staying invested.
Allowing markets to evolve naturally, without mechanically adjusting exposure in response to concentration, has tended to produce better long-term outcomes.
That said, concentration is not without risk. While it often reflects underlying fundamentals, periods of elevated concentration can still amplify downside risk under adverse regulatory, technological or macroeconomic shocks, particularly when correlations across markets rise. As with all portfolio considerations, the key is not to eliminate concentration, but to understand it and manage it deliberately within the context of broader diversification and risk controls.
To further assess concentration as a driver of market risk, Chart 5 shows the rolling volatility of a capitalisation-weighted U.S. equity index relative to an equal-weighted index. If higher concentration had led to increased equity market risk, we would expect to see a rise in relative risk from 2015 through 2024, but this has not been the case.
CHART 5: Relative volatility of cap- and equal-weighted U.S. equities
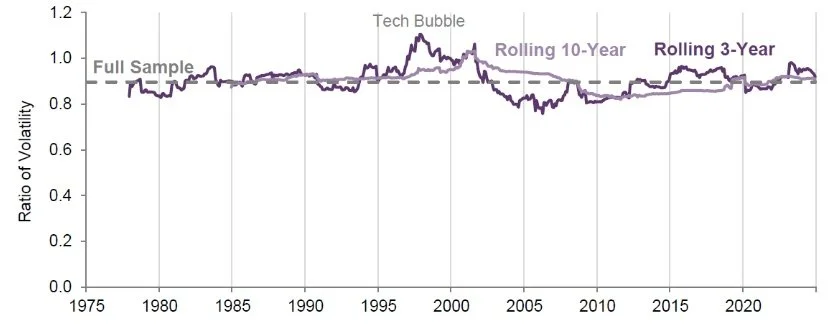
Source: AQR, MSCI. Chart shows ratio of volatilities of MSCI U.S. Cap-Weighted and Equal-Weighted indices, based on monthly data. A ratio trending upwards would suggest that the cap-weighted index is becoming relatively riskier. Daily data shows a similar pattern. Jan 1, 1975 - Dec 31, 2024
CONCENTRATION REFLECTS EARNINGS POWER, NOT SPECULATION
Another common concern is that concentration is driven by sentiment rather than fundamentals. However, the largest companies account for a disproportionately large share of total earnings and economic profit, often far exceeding their share of index weights. In 2023 for instance, the top 10 stocks made up 27 percent of the US market capitalisation, while earning 69 percent of the markets economic profit.
CHART 6: Economic profit of top 10 by market cap and of rest of universe (USA)
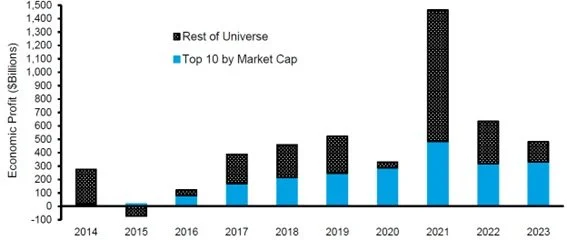
Source: Counterpoint Global and FactSet. 2014 - 2023.
In other words, market leadership is not arbitrary. The largest companies tend to generate substantial cash flows, reinvest heavily, and earn returns that justify their size. Concentration often reflects fundamentals catching up with success.
LARGE COMPANIES ARE NOT “SINGLE BETS”
It is easy to think of large index constituents as concentrated exposures. In reality, many of the world’s largest companies resemble diversified portfolios in their own right.
These businesses typically operate across multiple geographies, serve a wide range of customers, and offer a broad mix of products and services. Their revenues are not reliant on a single market, client, or outcome.
Size also brings flexibility. Large companies tend to have greater financial resources, more established supply chains, and the ability to adapt when conditions change, whether by adjusting investment plans, reallocating capital, or streamlining operations.
For investors, this means that exposure to large companies is often exposure to a broad set of economic activities, rather than a narrow or fragile bet. In many cases, scale can act as a stabilising force rather than a source of risk.
MARKETS ALREADY PRICE CONCENTRATION
High market concentration is often interpreted as a warning sign for future returns. In practice, the historical relationship has been relatively weak. Periods when a small group of companies has dominated the market have been followed by a wide range of outcomes, with no clear pattern in subsequent returns.
Where risks have emerged, they have usually been driven by broader market conditions rather than concentration itself. Ultimately, it is changes in business fundamentals and investor expectations that shape market outcomes, neither of which automatically deteriorate simply because market leadership becomes more concentrated.
CHART 7: Market concentration versus one-year forward S&P500 returns
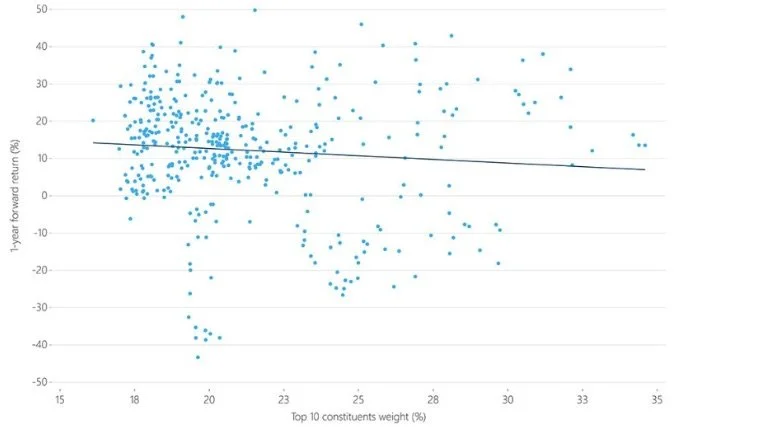
Source: Bloomberg, Barclays Private Bank. September 2025
WHAT THIS MEANS FOR INVESTORS
None of this suggests that diversification is unimportant, it remains a cornerstone of sound portfolio construction. However, portfolio responses to concentration should be deliberate and aligned to investor objectives, constraints and risk tolerance, rather than mechanically driven. Reducing exposure solely because market leadership has narrowed, risks under-allocating to the most profitable businesses, increasing turnover and behavioural mistakes, and sacrificing returns without meaningfully reducing risk. Concentration itself is not a market flaw, but often the visible outcome of innovation, productivity, and competitive advantage at work. History shows that it is a recurring feature of markets, does not reliably signal higher risk, and that large companies are often more resilient than they appear. Rather than fearing concentration, investors may be better served by understanding why it exists and by staying focused on long-term objectives rather than short-term discomfort.
Q4 2025 Update & Fund Commentary

Our Quarterly Commentary aims to carry and share the bulk of our reflections and analysis of the previous quarter. To help cater to your preferences, we've provided various avenues for navigating through an entire Quarter's worth of news and data.
You can view the full recorded feedback session (± 1hr 10mins) here for a deep dive into the last quarter
The presentation slides are also linked below
And for the real meat, scroll a little further to find the full detailed commentaries on both South African (9 pages) and Global markets (9 pages) and portfolios
To catch up on past insights, please visit our blog for a recap of previous commentaries.
And, of course, if you'd like to engage in further discussion, please don't hesitate to reach out. We're always here and ready to chat.
PortfolioMetrix Recorded feedback session
The PortfolioMetrix team has recorded their feedback session, discussing a few key aspects from this last quarter. We trust you'll enjoy and find this summarised commentary valuable.
In this quarter’s investment feedback session, Brendan de Jongh examined how 2025 once again exposed the limits of market forecasts. He showed how confidently held predictions across equities, currencies, and macro outcomes often fail, reinforcing the importance of disciplined portfolio construction over attempting to predict markets.
Brendan also reviewed what actually drove returns in 2025, highlighting a rare period of global equity outperformance without a breakdown in US fundamentals, alongside an exceptional year for South African asset classes. He challenged growing concerns around market concentration, arguing that it more often reflects underlying earnings strength than excess risk. The key takeaway: long-term investment outcomes are driven by participation, diversification, and discipline, not prediction.
Whether you missed the live session or want to revisit the insights, the full recording is now available below.
Quick timestamps for your convenience:
04:30 – Why market forecasts consistently fail
22:10 – What actually drove markets in 2025 (global & South Africa)
47:15 – Market concentration: risk signal or natural outcome
55:16 – Portfolio performance review and peer comparison
The Quarterly Feedback Session & Presentation Slides are linked below:
For the full Local & Global Quarterly Fund Commentaries, please click the links below:

Local Fund Commentary
Provides a commentary on the past quarter, its events and their impacts; as well as more intimate commentary on each moving part within your portfolios.
Global Fund Commentary
Provides intimate commentary on each moving part within your global portfolios over the past quarter.

December 2025 Update


Global Update | December 2025
Provides an overview of current global market dynamics and essential insights.

Local Update | December 2025
Provides an overview of current local market dynamics and essential insights.
Performance Links

Don’t leave without becoming an F&A insider
Sign up to receive regular business & investment updates from our blog